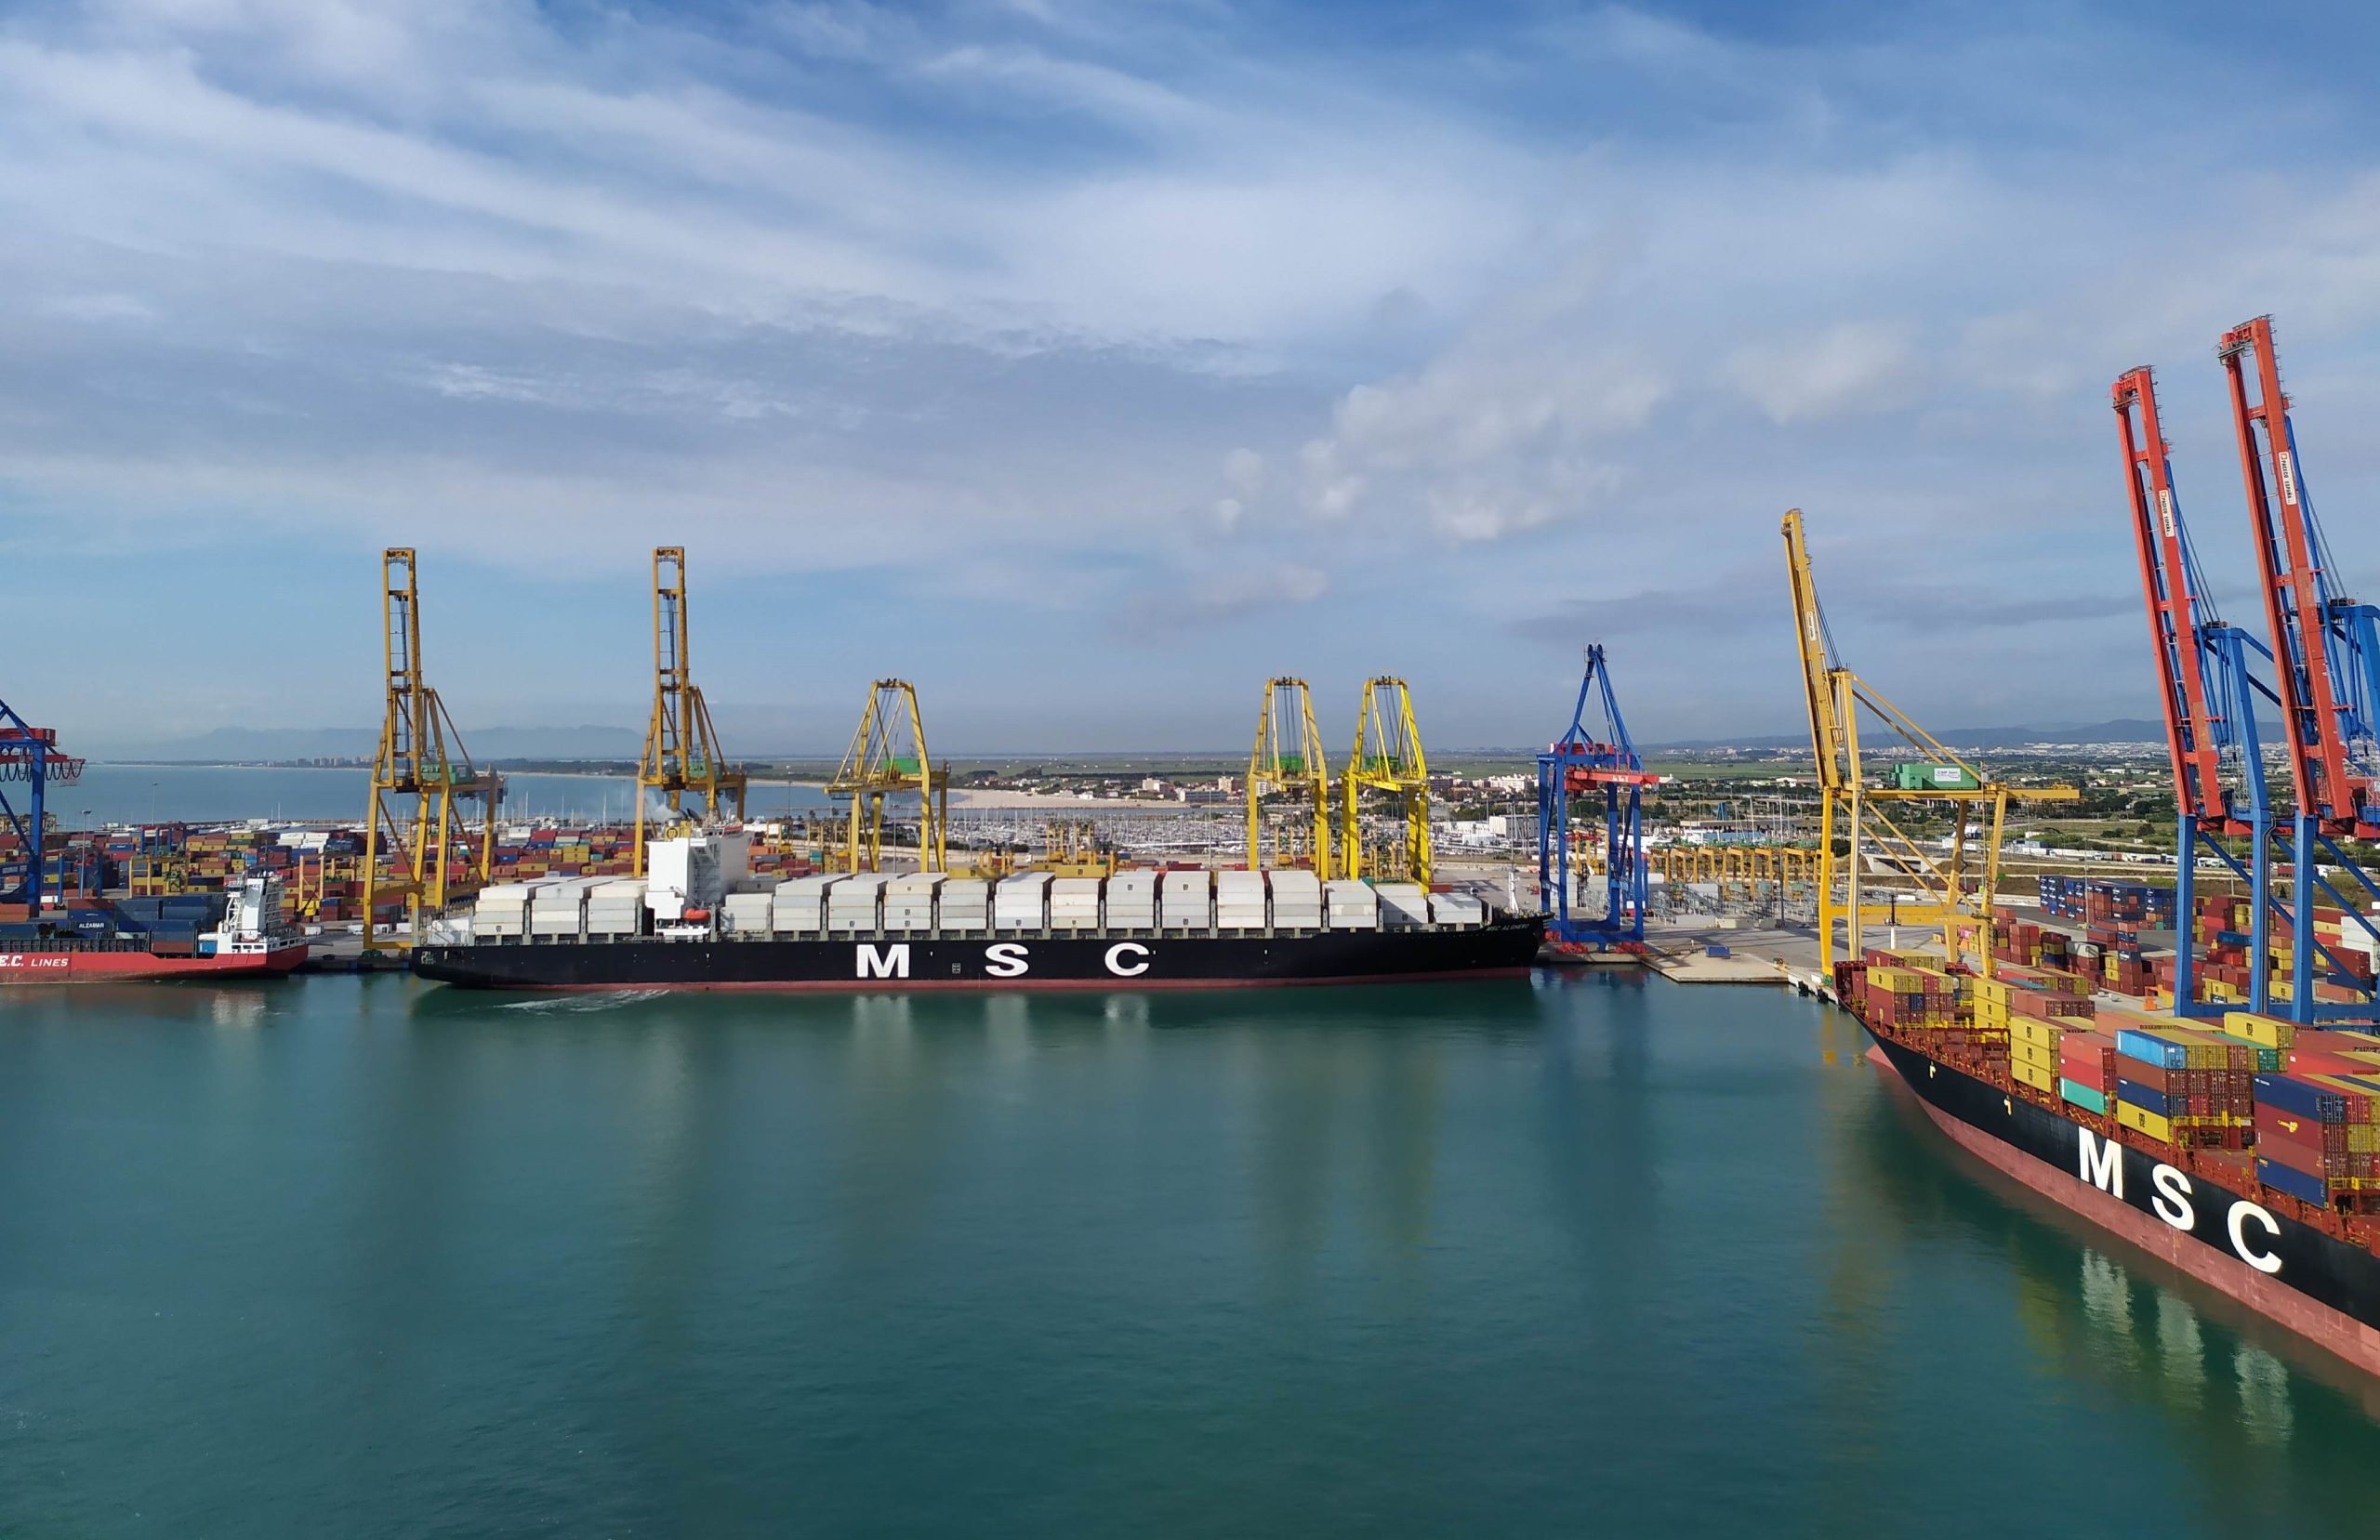
- Between January and September 2022, a total of 3,038,695 tonnes of natural gas have been moved through the Sagunto Port
- Liquid bulks, due to the push of natural gas but also of other energy products, have the highest traffic in the history of Valenciaport
- Solid bulks (cereals or animal feed) also show a great dynamism with an increase of 8.74%
- The geopolitical situation and the economic uncertainty mark Valenciaport’s figures. In the first nine months of the year, freight traffic fell by 3.27% and container traffic fell by 6.59%
Source: Valenciaport
The arrival of natural gas at the Port of Sagunto has tripled during the first nine months of this year to reach 3,038,695 tonnes compared to 1,039,875 tonnes in 2021, which represents an increase of 192.22% according to data from the Statistical Bulletin of the Port Authority of Valencia (PAV). Of this total, practically 60% comes from the United States, which has become the main supplier to the Sagunto site. A situation marked by the geopolitical scenario – with the war in Ukraine or the situation with Algeria – which has positioned the Port of Sagunto, which has a regasification plant, as a strategic point for the import/export of this energy source.
This uncertainty in the world economy characterises the Valenciaport figures for the January-September period. Thus, total freight traffic amounted to more than 61.7 million tonnes, which represents a decrease of 3.27%. If we analyse total traffic by form of presentation, liquid bulk increased by 80.46%, solid bulk by 8.74%, non-containerised goods increased by 1.03%, while containerised goods fell by 8.75%.
In this regard, it should be noted that liquid bulks, due to the push of natural gas but also of other energy products, present the highest traffic in the history of Valenciaport, while solid bulks (cereals) are also close to record records dating back to the beginning of 2019. Two indicators that show the complexity of trade and the international situation that are generating imbalances in the value chain that make many shipping companies opt for loading and unloading ports in safe ports and with great capacity to receive this type of products, such as the ports managed by the PAV.
About the movement of TEUs (standard 20-foot containers), between January and September, 3,949,066 units have been mobilised, representing a fall of 6.59%. Full containers dedicated to imports grew by 7.5% in the first nine months of the year, those for export fell by 6.88% and those for transit fell by 13.05% (244,815 units less), while empty containers fell by 2.62%.
Vehicles and countries
Regarding ro-ro traffic (system by which a vessel transports cargo on wheels), in the first nine months of the year, 9,898,575 tonnes have been handled, 0.68% more than the same period of 2021; while cars in cargo regime stood at 429,303 units, 14.85% more. On the other hand, passenger traffic exceeded one million people (including regular lines and cruise passengers), with a total growth of 141%. Specifically, 612,886 regular line passengers and 451,394 cruise passengers, which represents an 8-fold increase in the number of this type of visitor, bearing in mind that the cruise industry was limited for many months in 2021.
Regarding total traffic by country, the United States is the one that has generated most movement with a total of 6,698,293 tonnes and a growth of 18.68%. A third of this traffic is imports, which increased by 200%. This was followed by Italy with 5,760,380 tonnes with a decrease of 0.7%, while China was in third place with a decrease of 7% and a total of 4,844,317 tonnes. About the countries that handle the most containers with Valenciaport, China is in first place with 426,605 (-7.53%), followed by the United States with 386,581 (-4.36%) and Turkey with 195,253 (-17.27%). The most dynamic in the first nine months of the year were the United Kingdom with an increase of 54.68% and Australia with 18.8% more.
![]()


